Introduction
In recent years, Bitcoin has transformed from a niche digital currency into a mainstream financial instrument. In 2024 alone, approximately $4.1 billion was lost to DeFi hacks, emphasizing the need for security in cryptocurrency investments. Understanding Bitcoin price historical data is essential for both seasoned investors and newcomers looking to navigate this volatile market.
What is Bitcoin Historical Data?
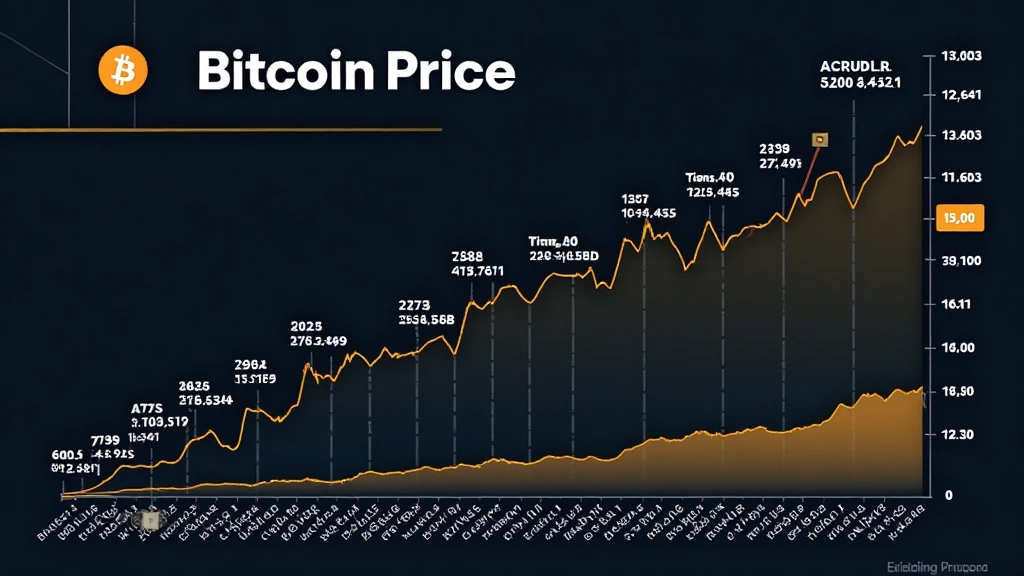
Simply put, Bitcoin historical data encompasses the pricing, trading volume, and other relevant metrics associated with Bitcoin since its inception in 2009. Analyzing this data can provide insights into market trends, investor sentiment, and future price movements.
- Price Trends: Understanding how Bitcoin’s price has fluctuated over time.
- Volume Analysis: Insights into trading volume and its correlation with price movements.
- Market Sentiment: Gauging how historical data reflects investor optimism or pessimism.
The Importance of Historical Data
Investors often refer to historical data to inform their trading decisions. Here’s why it’s so crucial:

- Market Timing: Historical data can help investors identify optimal entry and exit points.
- Risk Assessment: Understanding past volatility aids in assessing potential risks.
- Pattern Recognition: Recognizing historical patterns can help forecast future price movements.
Bitcoin Price Historical Data: Key Milestones
Early Days: 2009 – 2013
Bitcoin started trading at a negligible price and went through various phases of growth.
- 2010: The first recorded Bitcoin transaction occurred when someone bought two pizzas for 10,000 BTC.
- 2013: Bitcoin hit $1,000 for the first time, marking psychological significance for investors.
2014 – 2016: A Period of Regulations and Recovery
After reaching an all-time high, Bitcoin faced numerous challenges, including regulatory scrutiny.
- 2014: The collapse of Mt. Gox, a major exchange, led to a significant price drop.
- 2016: Bitcoin continued to rise as ETF proposals attracted investor interest.
The Bull Run: 2017
The year saw Bitcoin reaching nearly $20,000, capturing global media attention.
- December 2017: Bitcoin’s price peaked, leading to mass adoption discussions.
2018 – 2019: The Bear Market
Many investors suffered losses as prices plummeted to around $3,000.
- 2018: Bitcoin underwent a significant downtrend, teaching investors about market cycles.
2020 and Beyond: The Resurgence
By the end of 2020, Bitcoin was trading at $29,000, demonstrating a strong recovery.
- 2021: Bitcoin surpassed $60,000 amidst increasing institutional adoption.
Accessing Bitcoin Price Historical Data
To access Bitcoin historical data, consider the following platforms:
- Hibt.com: Comprehensive charts and trading insights.
- CoinMarketCap: Real-time tracking of Bitcoin prices and historical data.
- CryptoCompare: Historical price data alongside other cryptocurrencies.
The Future of Bitcoin: Analyzing Trends
As we look toward the future, here are factors to consider:
- Institutional Investment: A growing trend in Bitcoin adoption.
- Technological Advances: The impact of blockchain upgrades and scalability solutions.
- Market Regulation: How future regulations will influence market dynamics.
Conclusion
Understanding Bitcoin price historical data is vital for anyone looking to invest in cryptocurrency. By analyzing past trends, prices, and key milestones, investors are better positioned to make informed decisions about their investments.
With the growing interest in cryptocurrencies, the potential for future gains is immense, especially in markets like Vietnam, where the user growth rate reached 71% in 2023. As you navigate this evolving landscape, remember to stay informed and updated.
For more resources and insights, visit btcmajor.
Frequently Asked Questions
- What is the best source for Bitcoin historical data?
Depending on your needs, Hibt.com and CoinMarketCap are great options.
- How can historical data inform my investments?
Historical data reveals patterns and trends that can guide your investment strategies.


