Introduction
In the ever-evolving landscape of cryptocurrency trading, understanding Bitcoin price chart patterns can be the key to navigating the market effectively. As of 2024, it’s estimated that over 300 million people globally have engaged with cryptocurrencies, with Vietnam witnessing nearly a 50% increase in cryptocurrency users over the past year alone. With $4.1 billion lost to DeFi hacks in 2024, it’s crucial to arm ourselves with the right knowledge to avoid such pitfalls. This article aims to demystify Bitcoin price chart patterns, aiding both novice traders and seasoned investors in making informed decisions.
Understanding Price Chart Patterns
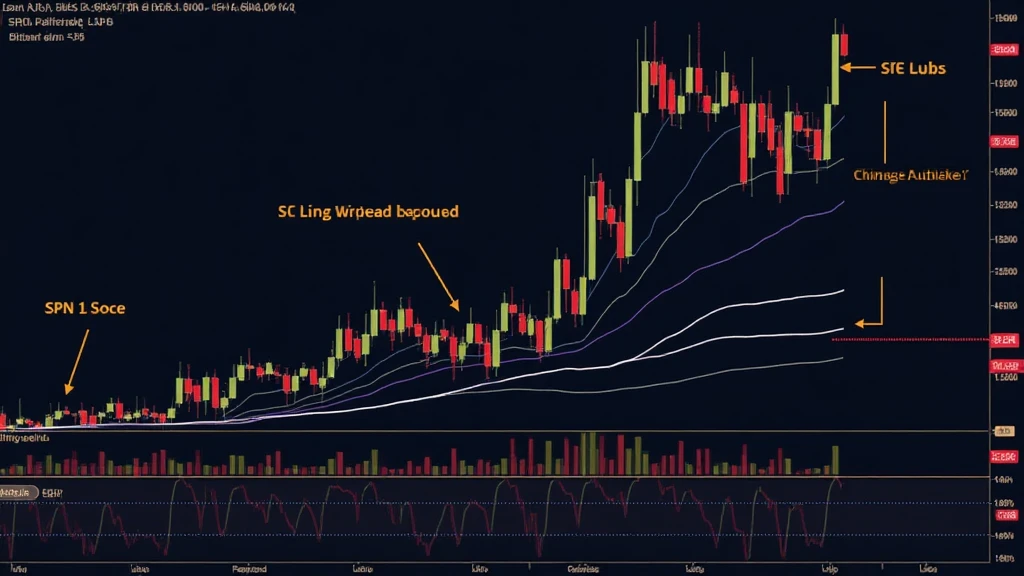
Price chart patterns are like the fingerprints of market behavior, revealing how traders react under different conditions. They can provide insights into potential price movements, making them vital for anyone engaged in buying and selling Bitcoin. Let’s break it down:
- Chart Types: Understanding different types of charts, such as line charts, bar charts, and candlestick charts, is fundamental. Candlestick charts, for example, visually depict the open, close, high, and low prices.
- Support and Resistance Levels: These levels indicate where Bitcoin’s price tends to reverse or consolidate. Knowing how to identify these levels can significantly enhance your trading strategy.
- Trend Lines: Drawing trend lines helps in visualizing the direction of price movements. An upward trend indicates bullish market sentiment, while a downward trend indicates bearish sentiment.
Common Bitcoin Price Chart Patterns
There are several common price patterns traders rely on to analyze Bitcoin’s price movements:

- Head and Shoulders: This pattern often indicates a reversal in trend. An upward head and shoulders signify a potential bearish market, whereas an inverse head and shoulders can suggest a bullish market.
- Double Top and Bottom: A double top appears after an uptrend and suggests a bearish reversal, while a double bottom indicates a potential bullish reversal.
- Triangles: Triangular patterns can be continuation patterns in an existing trend. Symmetrical triangles may suggest a period of consolidation before the price direction is determined.
The Importance of Volume in Price Patterns
Volume is a critical aspect that should not be overlooked when analyzing price patterns. It helps confirm trends and patterns:
- High volume during a breakout can indicate a strong move, while low volume might suggest a weak trend.
- For instance, if Bitcoin breaks out from a resistant trend line with increased volume, it reinforces the idea that the price will continue rising.
Using Price Patterns in Trading Strategies
Incorporating price chart patterns into your trading strategy can significantly increase the success rate. Here are some useful techniques:
- Risk Management: Setting stop-loss orders based on chart patterns can help minimize losses. For example, placing a stop-loss just below a support level can safeguard against unexpected market movements.
- Entering and Exiting Trades: Patterns like the breakout from a double bottom can serve as a signal to enter a trade, while formations like the head and shoulders can signal an exit.
- Combining with Other Indicators: Using other technical indicators such as the Relative Strength Index (RSI) can provide additional confirmation for your decisions.
Real Data: Bitcoin Market Movements
Analyzing historical data can provide valuable insights into potential future movements:
| Date | Price | Notable Event |
|---|---|---|
| January 2023 | $40,000 | Bitcoin breach of key support level |
| July 2023 | $30,000 | Formation of double bottom pattern |
| October 2023 | $50,000 | Head and shoulders pattern emerged |
Source: hibt.com
The Role of Psychology in Bitcoin Trading
Market psychology is a formidable force in cryptocurrency trading. Understanding trader emotions can help you anticipate market movements:
- Fear and greed often drive market cycles, which are reflected in chart patterns.
- For example, during a bullish trend, traders may exhibit greed, leading them to buy at the top, which can create a double top pattern as the price subsequently declines.
Conclusion
As we delve deeper into the world of Bitcoin price chart patterns, it’s crucial to remember that while these patterns can provide substantial insights, they should be used in conjunction with proper risk management techniques and market research. With Vietnam’s increasing engagement in the crypto sector and trends reflecting significant market shifts, traders must evolve and adapt to these changes. Understanding these patterns can be the difference between a successful trade and a costly mistake.
To explore more about Bitcoin price chart patterns and enhance your trading strategy, visit btcmajor.
Author Bio
Dr. Alex Tran: A renowned blockchain expert with over 15 published papers in the field. He has lead audits for several high-profile projects in the cryptocurrency industry. With a commitment to educating others, Dr. Tran empowers the next generation of traders.


