
Understanding Bitcoin Price Chart Patterns: Insights for Investors
With over 4.1 million Bitcoin wallets created just last year, the world of cryptocurrency is booming, especially in markets like Vietnam where interest is surging. Investors consistently look for trends and patterns to guide their trading decisions, particularly regarding Bitcoin’s price. This article provides a deep dive into Bitcoin price chart patterns, their significance, and how they can be analyzed for informed market participation.
What Are Bitcoin Price Chart Patterns?
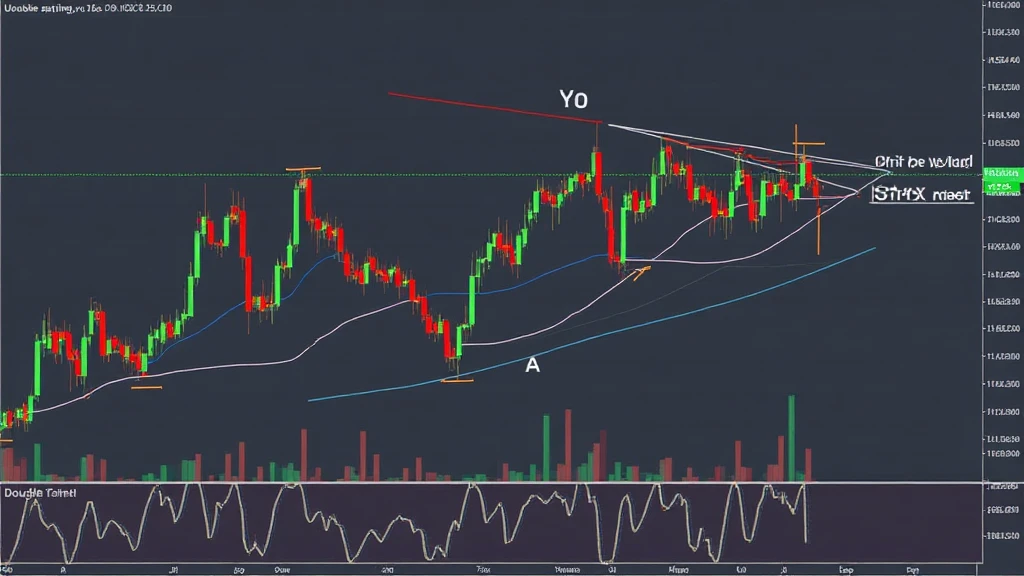
Bitcoin price chart patterns are graphical representations of Bitcoin price movements typically over various time frames. These patterns help investors identify trends, reversals, and potential breakout points in the Bitcoin market.
Chart patterns are essential because they display historical price behavior which often recurs. Patterns like the head and shoulders, double top/bottom, and ascending triangles provide insights into future movements. For instance, an ascending triangle often indicates a bullish breakout, suggesting that Bitcoin’s price may rise after forming this pattern.
Why Price Chart Patterns Matter
Understanding price chart patterns can offer critical insights. Here’s why:
- Market Psychology: These patterns reflect trader behavior and sentiment, indicating whether the market is bullish or bearish.
- Risk Management: Recognizing patterns can help traders set appropriate stop-loss orders, limiting potential losses.
- Strategic Planning: Patterns can inform strategies related to entry, exit, and overall market engagement.
Common Bitcoin Price Chart Patterns
Head and Shoulders
The Head and Shoulders pattern is a classic indicator of a reversal in trends. It consists of three peaks, with the middle peak (the head) being the highest. This pattern indicates a potential transition from a bull market to a bear market.
Double Tops and Bottoms
Double tops indicate that the price of Bitcoin has peaked twice at a certain level before falling, signaling a likely reversal from bullish to bearish. Conversely, double bottoms suggest Bitcoin has hit a low point twice and may rebound, indicating bullish sentiment.
Triangles
Triangle patterns, whether ascending, descending, or symmetrical, denote periods of consolidation. Traders look for breakout opportunities following the formation of these patterns, as they often signal significant price movements.
Analyzing Bitcoin Price Chart Patterns
When analyzing Bitcoin price chart patterns, consider these steps:
- Identify the Pattern: Use charting tools to identify structures such as head and shoulders or triangles.
- Volume Analysis: Increased trading volume can affirm the strength of a breakout.
- Historical Context: Review past performance of similar patterns to predict future movements.
- Combine with Technical Indicators: Integrating indicators like the Relative Strength Index (RSI) can enhance analysis.
The Role of Vietnam in Crypto Trends
In Vietnam, cryptocurrency engagement is on an upward trajectory. By 2023, it was reported that over 40% of Vietnamese internet users are engaged in crypto trading. This remarkable growth signifies the potential market for Bitcoin price chart analysis among Vietnamese investors.
With this audience in mind, local trends and interests can help shape trading strategies. Understanding specific regional market action—such as Vietnam’s interest in decentralized finance (DeFi) tools—can influence how chart patterns are utilized within these communities.
Conclusion
As Bitcoin continues to dominate the cryptocurrency space, understanding its price chart patterns is crucial for both novice and experienced traders. These patterns provide insights into market sentiment and can help traders make informed decisions.
It is vital to stay updated on both local and global trends as they directly affect price movements and investor behavior. In Vietnam’s growing crypto market, being able to recognize patterns and understand their implications can greatly enhance trading strategies.
For ongoing updates and insights, whether trading locally or globally, remember to check platforms like hibt.com, which provide valuable tools and resources to guide your trading journey.
In summary, Bitcoin price chart patterns serve as a compass for investors navigating the volatile cryptocurrency waters, providing crucial insights that can enhance their trading strategies.
Not financial advice. Consult local regulators.
**Author: John Smith**
An experienced financial analyst, John has authored over **15** papers on cryptocurrency trends and has led multiple audits of notable blockchain projects. His insights on market behaviors have shaped many trading strategies in today’s financial landscape.