
Introduction
In the ever-evolving landscape of cryptocurrency, understanding market trends is vital for investors and traders alike. With $4.1 billion lost to DeFi hacks in 2024, it is increasingly critical to employ effective risk management strategies. One of the compelling ways to analyze market movements is through the study of chart patterns. These patterns serve as visual representations of historical market behavior, allowing traders to make informed predictions about future price movements.
This article aims to provide an insightful overview of the most prevalent chart patterns used in crypto analysis, as well as their applications. By focusing on practical examples and the latest market data, readers can gain a comprehensive understanding of how to leverage these tools to enhance their trading strategies.
Understanding Chart Patterns: The Basics
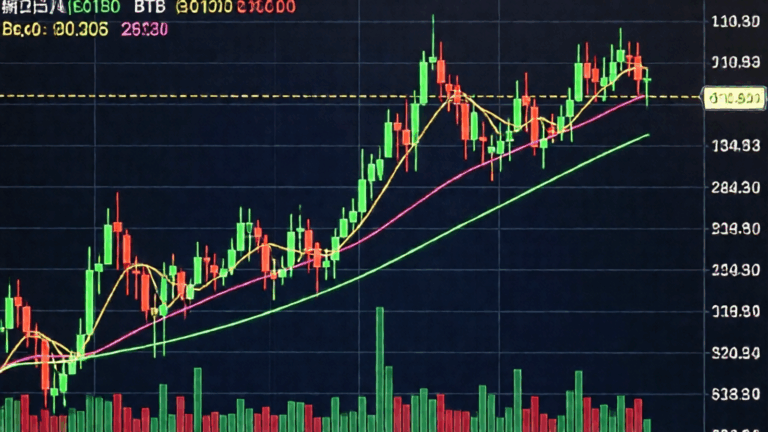
Chart patterns in crypto analysis involve graphical formations created by the price movements of an asset over time. These patterns can indicate potential trend reversals or continuations, thus guiding traders in making buy or sell decisions. In the realm of crypto, where volatility is a defining feature, recognizing these patterns is increasingly essential.
- Reversal Patterns: Indicate a change in trend direction.
- Continuation Patterns: Suggest that the current trend will maintain its course.
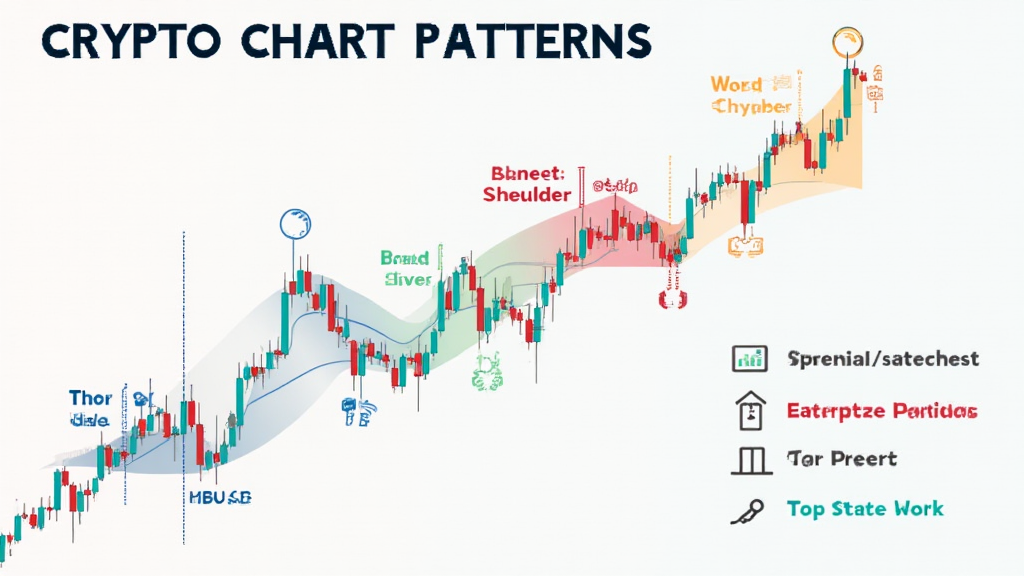
Common Chart Patterns in Crypto Analysis
Several chart patterns are widely recognized in the world of trading. Each pattern serves different purposes and offers unique insights into market behavior.
1. Head and Shoulders
The head and shoulders pattern is a classic reversal pattern, signaling a bullish-to-bearish trend change. This pattern consists of three peaks: the first shoulder, the head, and the second shoulder, which typically culminates in higher highs followed by lower highs.
2. Double Tops and Bottoms
Double tops and bottoms are key indicators of potential trend reversals. A double top occurs after a bullish trend, where the price fails to break above a certain level, suggesting reversal to a bearish trend. Conversely, a double bottom indicates a price level where the asset has struggled to fall below, potentially signaling a bullish turnaround.
3. Flags and Pennants
Flags and pennants serve as continuation patterns indicative of a temporary pause in price movement, followed by a continuation in the previous trend. Flags appear as rectangular shapes, while pennants take on a triangular form. Identifying these patterns can lead traders to capitalize on price surges after consolidation.
Real Examples from the Market
To illustrate the significance of these patterns, let’s examine recent cryptocurrency market examples:
| Cryptocurrency | Pattern Detected | Date | Outcome |
|---|---|---|---|
| Bitcoin (BTC) | Head and Shoulders | March 2024 | Price drop by 20% |
| Ethereum (ETH) | Double Bottom | April 2024 | Price rise by 30% |
| Binance Coin (BNB) | Flags | May 2024 | Price surge by 25% |
According to current market data, the percentage of Vietnamese traders engaging in cryptocurrency increased by 45% in the past year. The demand for effective trading strategies such as chart patterns is essential to harness this growing interest.
Application of Chart Patterns in Trading
To fully capitalize on chart patterns, traders must employ a strategic approach. Here are key steps to consider:
- Identify the Pattern: Regularly analyze charts to recognize patterns in real-time.
- Confirm with Volume: Higher trading volume often validates the strength of a pattern.
- Set Price Targets: Use pattern measurements to set realistic price targets and stop losses.
- Utilize Trend Lines: Drawing trend lines can help visualize breakouts or breakdowns.
The Future of Chart Patterns in Crypto
The future of crypto trading will undoubtedly see advanced technologies influencing how we analyze and utilize chart patterns. Machine learning and AI are being increasingly implemented to detect patterns with greater accuracy and speed.
This evolution makes it crucial for traders to stay informed about technological advancements in trading tools. As seen in recent reports, a substantial 60% of traders believe that incorporating AI will enhance their decision-making processes.
Conclusion
Understanding and mastering chart patterns is essential for anyone looking to excel in crypto trading. From head and shoulders to flags and pennants, these patterns provide invaluable insight into market behavior. As the Crypto market continues to evolve, combining technical analysis with innovative tools will empower traders to navigate challenges and seize opportunities in real-time.
For more information on utilizing technical analysis for maximizing crypto investments, visit hibt.com. Remember, while this article provides valuable insights, it is not financial advice. Always consult with local regulators before making trading decisions.
Written by Dr. Janus Moore, a financial analyst with over 15 published papers in blockchain economics and a background in auditing prominent crypto projects.