Understanding Bitcoin Halving Technical Indicators
The cryptocurrency market is a whirlwind of volatility, opportunities, and risks. With experts predicting various trends in crypto adoption, Bitcoin halving continues to stand out as a pivotal event that impacts the market. In the past few years, Bitcoin halving has gained tremendous attention among investors and enthusiasts. Notably, during the most recent halving event, analysts saw trends evolve rapidly, leading to both short-term gains and long-term investments. The question remains, how do technical indicators play a role in predicting outcomes during Bitcoin halving? Let’s break it down.
What is Bitcoin Halving?
Bitcoin halving refers to the event where the reward for mining new blocks is cut in half, reducing the rate at which new bitcoins are generated. This event occurs approximately every four years, or after the blockchain records 210,000 blocks. The most recent halving occurred in May 2020, with the next one expected in 2024. Historically, halving events are crucial as they coincide with notable price surges, making it essential to analyze technical indicators both before and after the event.
Why Bitcoin Halving Matters
- Supply Reduction: The limited supply can deepen scarcity, attracting market attention.
- Market Sentiment: Historical data shows that halving often leads to bullish sentiment, influencing traders’ decisions.
- Mining Dynamics: Reduced rewards affect miners, changing the operational landscape and impacting overall network security.
- Investment Strategies: Traders and investors often adjust their strategies based on expected outcomes following halving events.
Understanding the Role of Technical Indicators During Halving Events
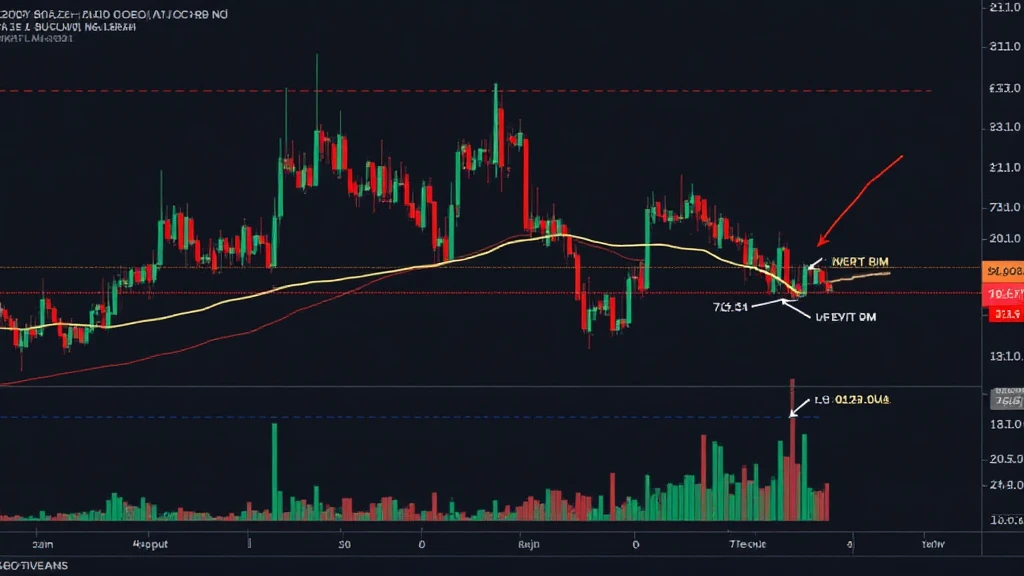
Technical indicators provide critical insights into market behaviors, especially surrounding halving events. Tools such as Moving Averages (MA), Relative Strength Index (RSI), and Volume Analysis help traders forecast potential market trends. Here’s a closer look at key indicators to watch:

1. Moving Averages (MA)
Moving Averages are a fundamental analysis tool. They smooth price action and help identify trends over specific periods. For instance:
- 50-Day MA: Indicates short-term support or resistance levels.
- 200-Day MA: Often viewed as a long-term trend indicator; if the price consistently stays above this, it signals a bullish trend.
As halving approaches and subsequently occurs, monitoring moving averages helps gauge whether prices are polarizing upward or downward.
2. Relative Strength Index (RSI)
The RSI is a momentum oscillator that measures the speed and change of price movements. Often used to identify overbought or oversold conditions, it ranges from 0 to 100. Values above 70 indicate overbought conditions while below 30 suggest oversold conditions, giving traders insights into potential reversal points.
This tool becomes invaluable during halving; in previous events, it has often highlighted when Bitcoin was due for a correction or consolidation.
Impact of Historical Bitcoin Halving Events
To understand the effectiveness of these technical indicators during halving events, let’s analyze historical trends associated with previous halvings:
First Halving (2012)
The first halving in November 2012 reduced the block reward from 50 to 25 bitcoins. Following the event, Bitcoin’s price skyrocketed from around $12 to over $1,000 within a year. During this period, the 200-Day MA climbed steadily, indicating a bullish market bias. The RSI also suggested rising momentum, confirming the price increase.
Second Halving (2016)
The second halving took place in July 2016, lowering rewards from 25 to 12.5 bitcoins. Again, the price action confirmed that historical trends remained relevant. Price increased from about $650 before halving to nearly $20,000 by the end of 2017. Here, both moving averages and the RSI showed clear bullish trends before achieving all-time highs, supporting strategic trading decisions.
Third Halving (2020)
May 2020 marked the third halving, reducing rewards to 6.25 bitcoins. The condition of the market showed initial volatility, yet prices rallied from approximately $8,000 to almost $65,000 in early 2021. Analyzing price charts through moving averages also indicated sustained bullish trends, enabling foreseen growth opportunities.
Bitcoin Halving and the Vietnamese Market
Vietnam’s user growth rate in cryptocurrency has skyrocketed, showing an increasing adoption of digital assets across the nation. The integration of Bitcoin halving into local trading activities has stirred significant interest. Local traders often leverage the technical insights derived from halving cycles paired with Vietnamese market data. This intertwining of technical analysis and local trends justifies a unique perspective on how halving impacts the regional market specifically.
Notable Vietnamese User Growth Rates:
- Last year: 132% increase in new wallet sign-ups.
- Predicted growth for 2025: Estimated at over 200%.
- Growing familiarity: Increased educational initiatives surrounding Bitcoin trading.
This combination of global technical indicators and local market understanding is essential for Vietnam’s traders as they navigate Bitcoin halving cycles.
How to Use Technical Indicators in 2025
As the next halving approaches, understanding how to utilize various technical indicators will be crucial for successful trading strategies.
- Understand market cycles and apply indicators on longer-term time frames to gauge sentiment effectively.
- Develop risk management approaches based on historical data, accounting for cashflow dynamics following halving events.
- Look out for Bitcoin dominance metrics as it can influence altcoin performance, particularly during halving margins.
Conclusion: The Future of Bitcoin Halving and Technical Indicators
Bitcoin halving showcases a unique intersection of supply reduction, market psychology, and technical analysis as traders and investors continue to monitor the crypto landscape. The use of technical indicators during these pivotal moments reveals potential market patterns, leading to informed decision-making. As we approach the next halving in 2024, understanding and utilizing these indicators will become crucial in navigating the complexities of the cryptocurrency market, especially in growing markets like Vietnam where the user base is set to mushroom.
Ultimately, aligning local data with global indicators presents a comprehensive strategy for engaging with Bitcoin halving outcomes. As we advance toward potential shifts and transformations in the digital asset sector, leveraging technical insights will empower traders to thrive in an ongoing evolving financial ecosystem.
At btcmajor, we remain dedicated to providing up-to-date insights and tools needed for savvy cryptocurrency engagement.
Disclaimer: Not financial advice. Consult local regulators.


