Introduction
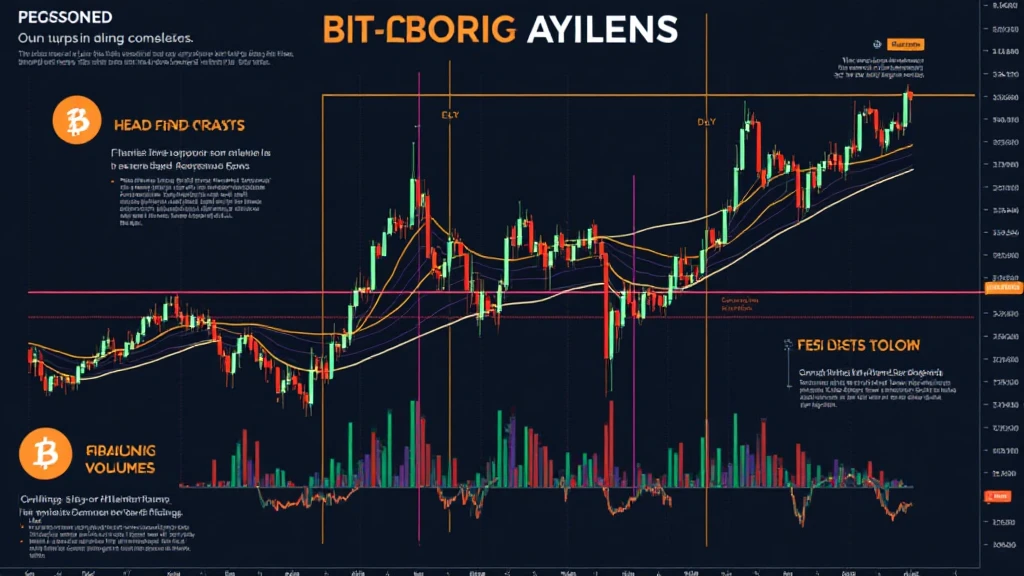
With over $4.1 billion lost to DeFi hacks in 2024, understanding the intricacies of Bitcoin price chart patterns has never been more crucial. As one of the most volatile assets in the digital finance world, Bitcoin’s price fluctuations can perplex both seasoned traders and newcomers. This article serves as a comprehensive resource, aiming to shed light on Bitcoin price chart patterns analysis.
Understanding Bitcoin Price Movements
Bitcoin, the pioneer of cryptocurrencies, often exhibits unique price movements influenced by various factors, including news, market sentiment, and investor behavior. To analyze these movements effectively, one must become acquainted with essential chart patterns.
- Support and Resistance Levels: These levels dictate where the price of Bitcoin tends to find stability. Investors typically look for buying opportunities near support levels and consider selling near resistance levels.
- Trend Lines: Drawing trend lines on charts allows traders to visualize the general direction Bitcoin is heading—upwards, downwards, or sideways.
Common Chart Patterns
A variety of chart patterns can emerge in Bitcoin’s price movements. Here are some significant ones:

- Head and Shoulders: This pattern often indicates a reversal in trend. When observed, traders might consider this a sign to enter or exit positions.
- Double Top and Double Bottom: These patterns signify potential market reversals, helping traders to predict shifts in price direction.
- Flags and Pennants: Generally regarded as continuation patterns, these signify the continuation of the trend following a brief consolidation phase.
Tools for Analyzing Bitcoin Price Patterns
Long gone are the days of manual calculations. Nowadays, trading platforms and software provide advanced tools for analysis:
- TradingView: A powerful platform for real-time data analysis, allowing traders to apply various indicators and chart patterns.
- CoinMarketCap: Besides tracking prices, this website offers insights into market capitalization and trading volume, essential for price analysis.
The Role of Volume in Chart Patterns
Volume plays a pivotal role in validating chart patterns. For example, if a bullish pattern forms with increasing volume, it reinforces the likelihood of a price uptrend. Conversely, low volume on a bearish pattern might suggest a lack of conviction behind the trend.
Analyzing Market Sentiment
Market sentiment significantly influences Bitcoin’s price. Platforms like Google Trends can help gauge public interest in Bitcoin and indicate potential price movements.
- Fear and Greed Index: This index measures market sentiment, helping traders understand whether the market is overly fearful or greedy.
- News Impact Analysis: Specific events can dramatically affect Bitcoin’s price. Analyzing how news affects market behavior can provide insight into future movements.
Real-World Case Studies
Analyzing historical price movements provides valuable insights. For instance:
- 2020 Bull Run: Following the March 2020 drop caused by the pandemic, Bitcoin’s price began forming patterns that led to the 2021 bull run. Patterns of higher lows and higher highs became apparent.
- 2018 Downtrend: Learning from the significant drop in Bitcoin’s price during 2018, one can identify patterns that signaled bearish trends.
Getting Started with Your Analysis
To begin your journey in Bitcoin price chart pattern analysis, consider these steps:
- Educate Yourself: Familiarize yourself with fundamental and technical analysis concepts.
- Practice with Demo Accounts: Many trading platforms offer demo accounts to practice without financial risk.
- Stay Updated: The cryptocurrency market is ever-evolving, so continual education is key.
Conclusion
Analyzing Bitcoin price chart patterns can empower traders to make informed decisions, thereby enhancing their potential for success in this volatile market. Armed with various tools and an understanding of market sentiment, anyone can embark on their trading journey. Remember, as with any investment, always conduct your research and assess your risk tolerance. For more detailed insights and analysis on cryptocurrencies, check out hibt.com.
As we continue to see growth in the cryptocurrency space, particularly in regions like Vietnam with a 34% growth rate among users in 2025, it becomes increasingly important to understand these patterns. Whether you are a seasoned trader or just starting, mastering the art of Bitcoin price chart patterns analysis will be invaluable.
Author: Dr. Minh Nguyen, a blockchain expert and author of over 25 papers in digital asset technology. He has led audits for prominent blockchain projects and provides insights into market trends.


