Understanding Bitcoin Price Analysis Using Fibonacci Retracement
With the growing popularity of cryptocurrencies, many traders and investors are grappling with how to predict Bitcoin prices effectively. In 2024 alone, over $4.1 billion was lost due to volatile trades in the DeFi sector, raising awareness about effective analysis tools. Among them, Fibonacci retracement has emerged as a reliable method for understanding Bitcoin price movements. This article provides an extensive overview of Bitcoin price analysis using Fibonacci retracement, equipping both novice and expert investors alike with valuable insights.
What Is Fibonacci Retracement?
Fibonacci retracement is a technical analysis tool that applies key levels based on the Fibonacci sequence to determine potential support and resistance levels in financial markets, including Bitcoin. Developed by Leonardo of Pisa in the 13th century, this sequence is found throughout nature and, remarkably, in market behaviors as well.
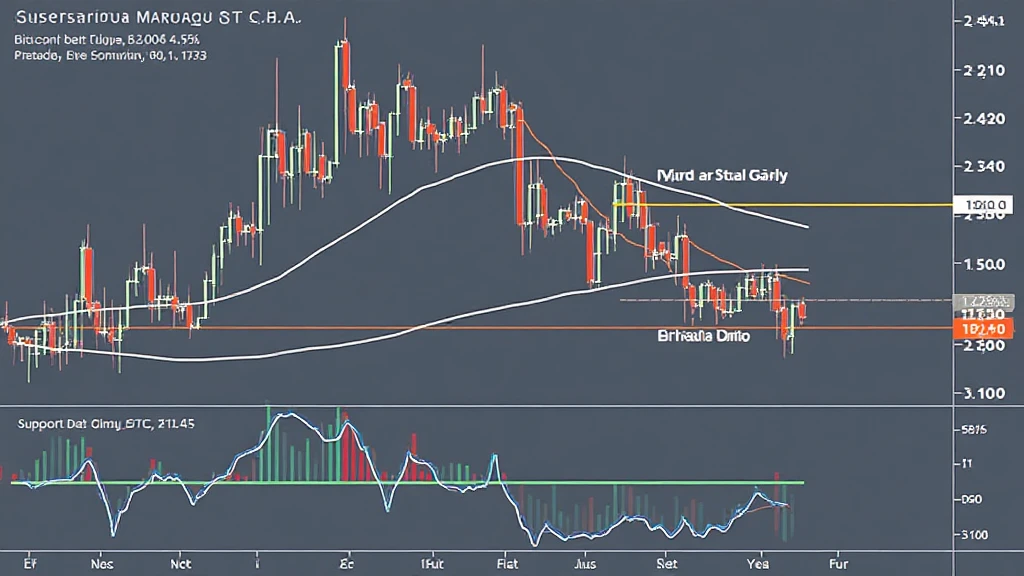
Here’s how it works: By plotting the key Fibonacci levels on a Bitcoin price chart, traders can identify possible reversal points where prices might bounce back during a correction phase.

Key Fibonacci Levels
- 23.6%: A minor retracement level indicating shallow corrections.
- 38.2%: A significant level where traders often look for buying opportunities.
- 50%: Artificially created level acknowledged for its psychological impact.
- 61.8%: Often deemed the most crucial level; a strong bounce typically occurs here.
- 100%: Indicates a complete retracement.
Applying Fibonacci Retracement in Bitcoin Analysis
Using Fibonacci retracement in Bitcoin price analysis can feel intricate, but let’s break it down.
1. **Identify the Trend**: First, determine whether Bitcoin is in an uptrend or downtrend. This step is pivotal as it influences your retracement strategy.
2. **Select Key Peaks and Troughs**: On the Bitcoin price chart, identify a significant peak (high) and trough (low) to draw your Fibonacci levels.
3. **Draw the Fibonacci Levels**: Use a trading platform to automatically generate Fibonacci retracement levels, or do it manually by inserting the percentage levels on the price chart.
4. **Look for Reversal Signals**: Watch for price action around the Fibonacci levels (specifically 38.2% and 61.8%) for signals. Key indicators like RSI (Relative Strength Index) may also confirm potential trend reversals.
5. **Manage Your Trade**: Always use risk management, setting stop-loss orders in accordance with your analysis.
The Role of Fibonacci Retracement in 2025 Bitcoin Predictions
As Bitcoin continues to evolve, 2025’s landscape paints a promising picture. Many analysts posit that Bitcoin’s price will experience heightened volatility due to speculations around its adoption and regulatory scrutiny. Predictions indicate it could touch new heights, making Fibonacci retracement pivotal for pinpointing entry and exit strategies.
The Vietnamese market is no different. With a reported user growth rate of over 30% in 2024 alone, understanding price movements via Fibonacci could empower investors navigating through price fluctuations.
Real-World Example
| Fibonacci Level | Price Point | Trend Reaction |
|---|---|---|
| 23.6% | $20,000 | Minor Resistance |
| 38.2% | $23,500 | Strong Buying Interest |
| 61.8% | $27,000 | Price Reversal Confirmed |
Data Source: TradingView, February 2025
The Psychological Aspect of Fibonacci Levels
Beyond the mathematical principles, Fibonacci levels carry a psychological weight. Market participants often react favorably as they approach these levels, leading to self-fulfilling prophecies. This is akin to how a bank vault secures transactions — it provides assurance, creating an environment that encourages consistent trading behavior.
Fibonacci Tools and Resources
To enhance your mastery of price analysis using Fibonacci retracement, several resources can aid your journey:
- HIBT – Your Go-To Platform: Equipped with sophisticated tools to analyze Bitcoin.
- TradingView: Comprehensive charts that allow you to customize Fibonacci levels.
- Utilize mobile apps such as Binance and CoinMarketCap for real-time updates.
Precautions When Using Fibonacci Retracement
While Fibonacci retracement has its merits, it’s vital to approach it with caution:
- Markets can behave unpredictably; always maintain a diversified portfolio.
- Combine Fibonacci analysis with other indicators—don’t rely solely on one method.
- Stay updated on global news that might affect Bitcoin prices.
Conclusion: Harnessing the Power of Fibonacci for Bitcoin Trading
In conclusion, understanding Bitcoin price analysis using Fibonacci retracement is essential for investors aiming to navigate through the complexities of the market effectively. As we look toward 2025 and the Vietnamese market continues to blossom with cryptocurrency adoption, employing tools like Fibonacci within your trading strategy may just be your key to success.
As with any investment, do thorough research and consult trusted advisers if necessary. Always remember, this isn’t financial advice, but a guide to help understand the fascinating dynamics of Bitcoin trading.
For more resources and insights on cryptocurrency trading, visit btcmajor.
About the Author
Dr. Sara Nguyen is a cryptocurrency analyst and educator, having published over 25 papers in blockchain technology and led audits on prominent crypto projects. Her expertise carries weight in a rapidly evolving landscape, where data-driven insights are crucial.


